
Custom PT Market Assessment
 Custom PT Market Assessment
What Growth Opportunities Are You Leaving on the Table?
When PT referrals leave your network, downstream MSK revenue follows. See exactly what that's costing you, where to recapture it, and where to expand your footprint.

Complimentary. Built on your market's data.
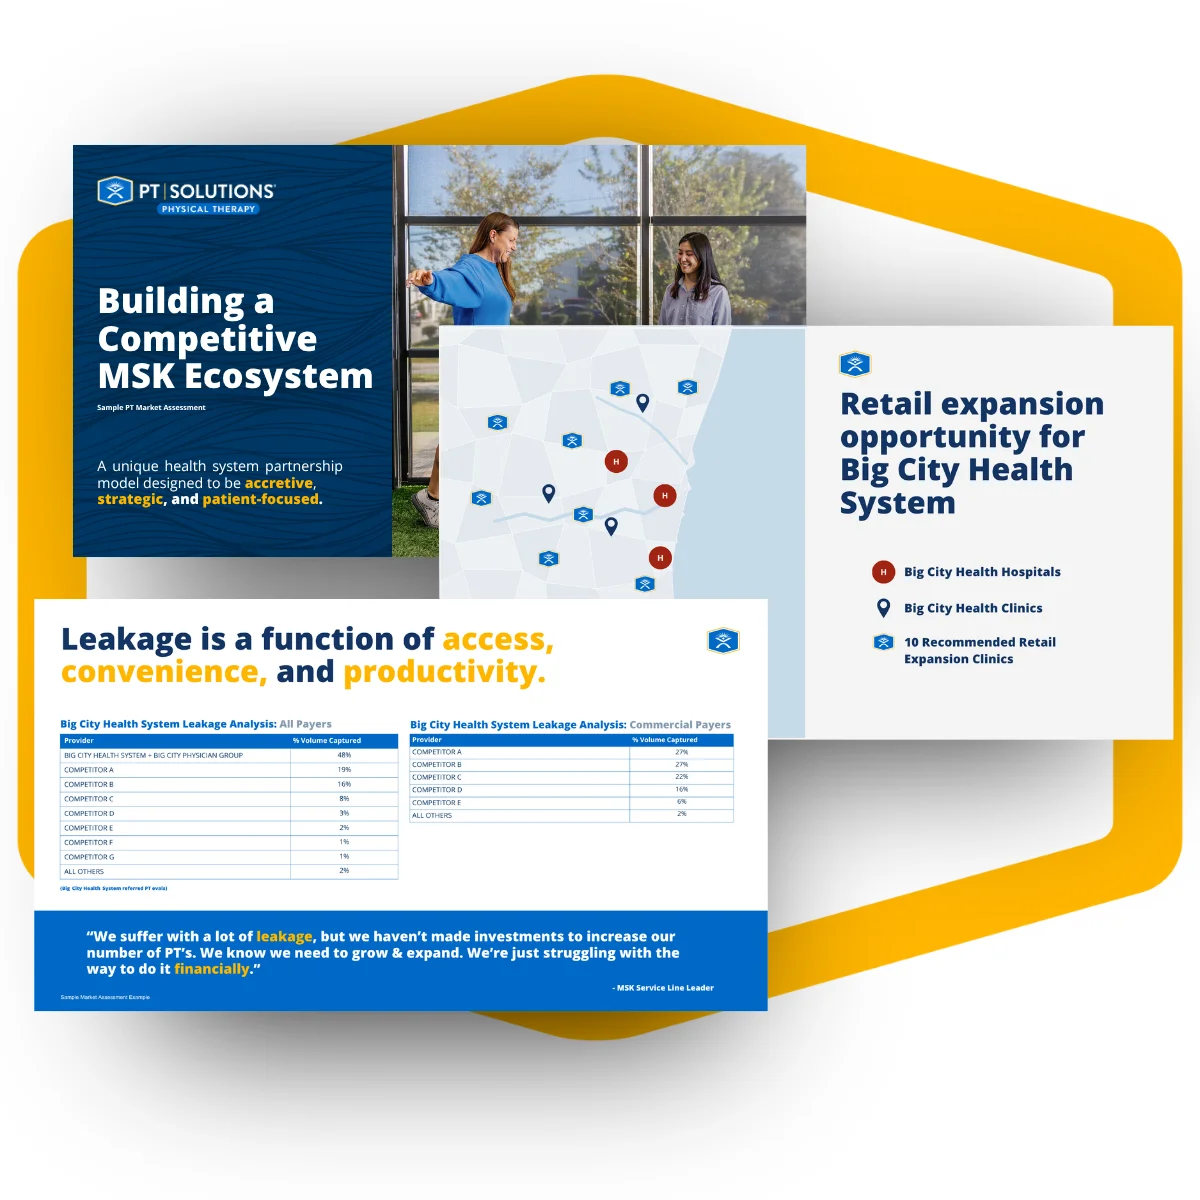
- Accretive
- Strategic
- Patient-focused
Keep Referred Patients in Your Network
A large share of the PT evaluations referred within your network can end up with competitors, along with the downstream MSK revenue that follows them.
Make PT a Front Door Strategy
For many patients, PT is where MSK care begins, and imaging, ortho visits, and procedures can follow. Accessible clinics in the right locations help keep that care in your network.
What Your Custom Assessment Reveals
A detailed view of where to unlock growth, what leakage costs you, and MSK strategy blindspots.
Retail Strategy Contribution
Your assessment models projected visits, revenue, and margin for a right-sized retail clinic expansion, based on your market's demand.
Protect and Grow Your Market Share
Every PT and Ortho provider in your market ranked by volume, so you can see who you compete with and how far ahead or behind you are.
 48%captured
 22%captured
- Captured in network
- Treated outside your network
PT Referral Capture Rate
See the share of PT evaluations your own providers refer that stay in network, the rate of leakage, and how that changes competitors and payer mix.
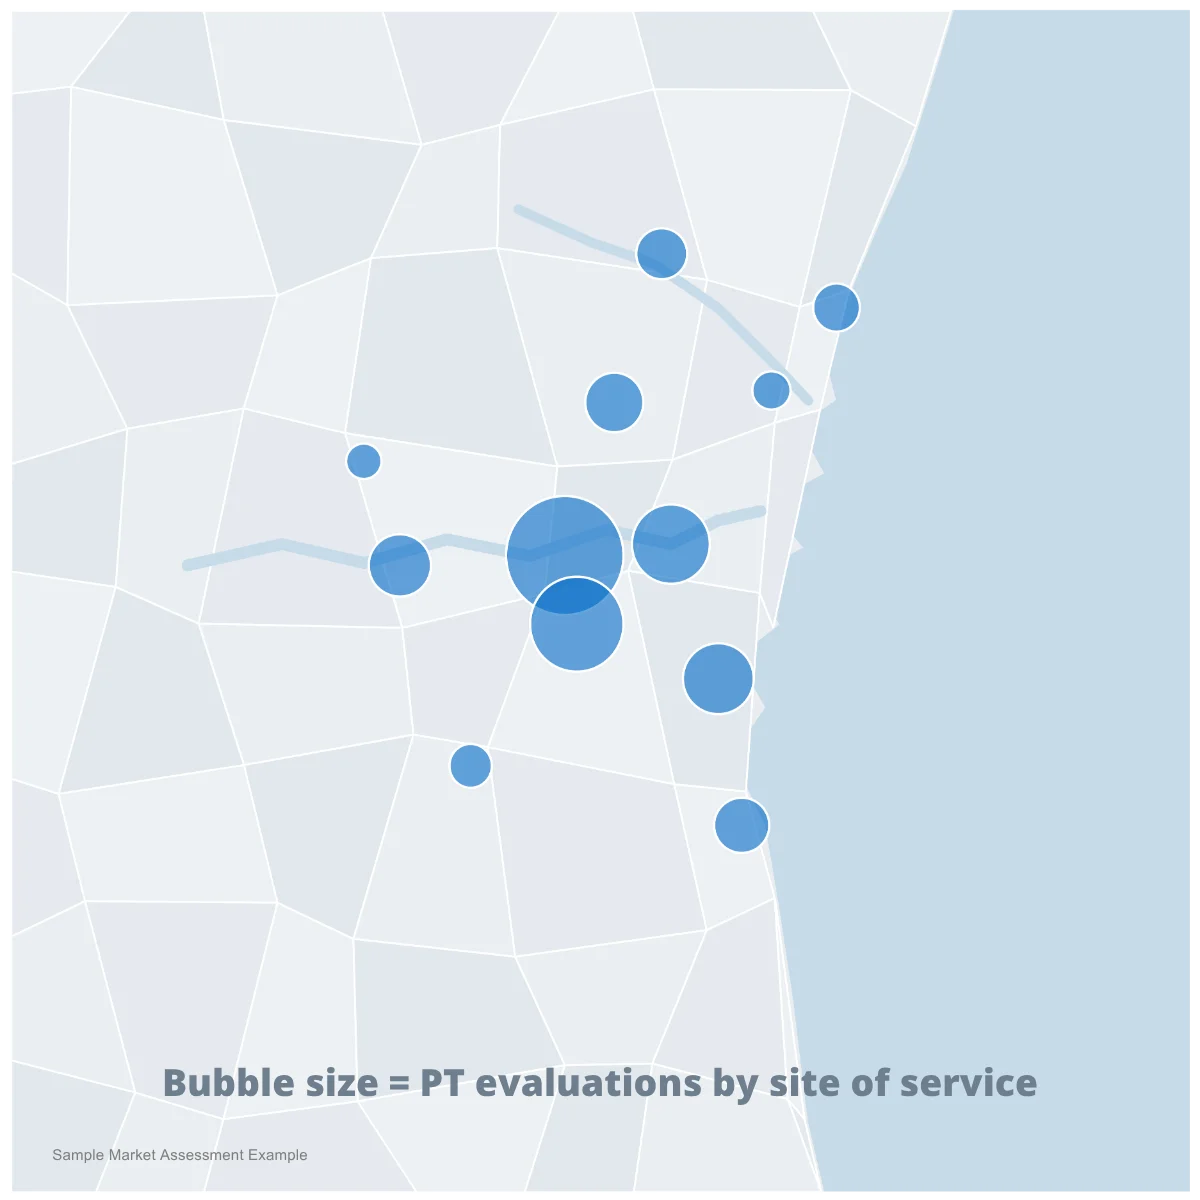
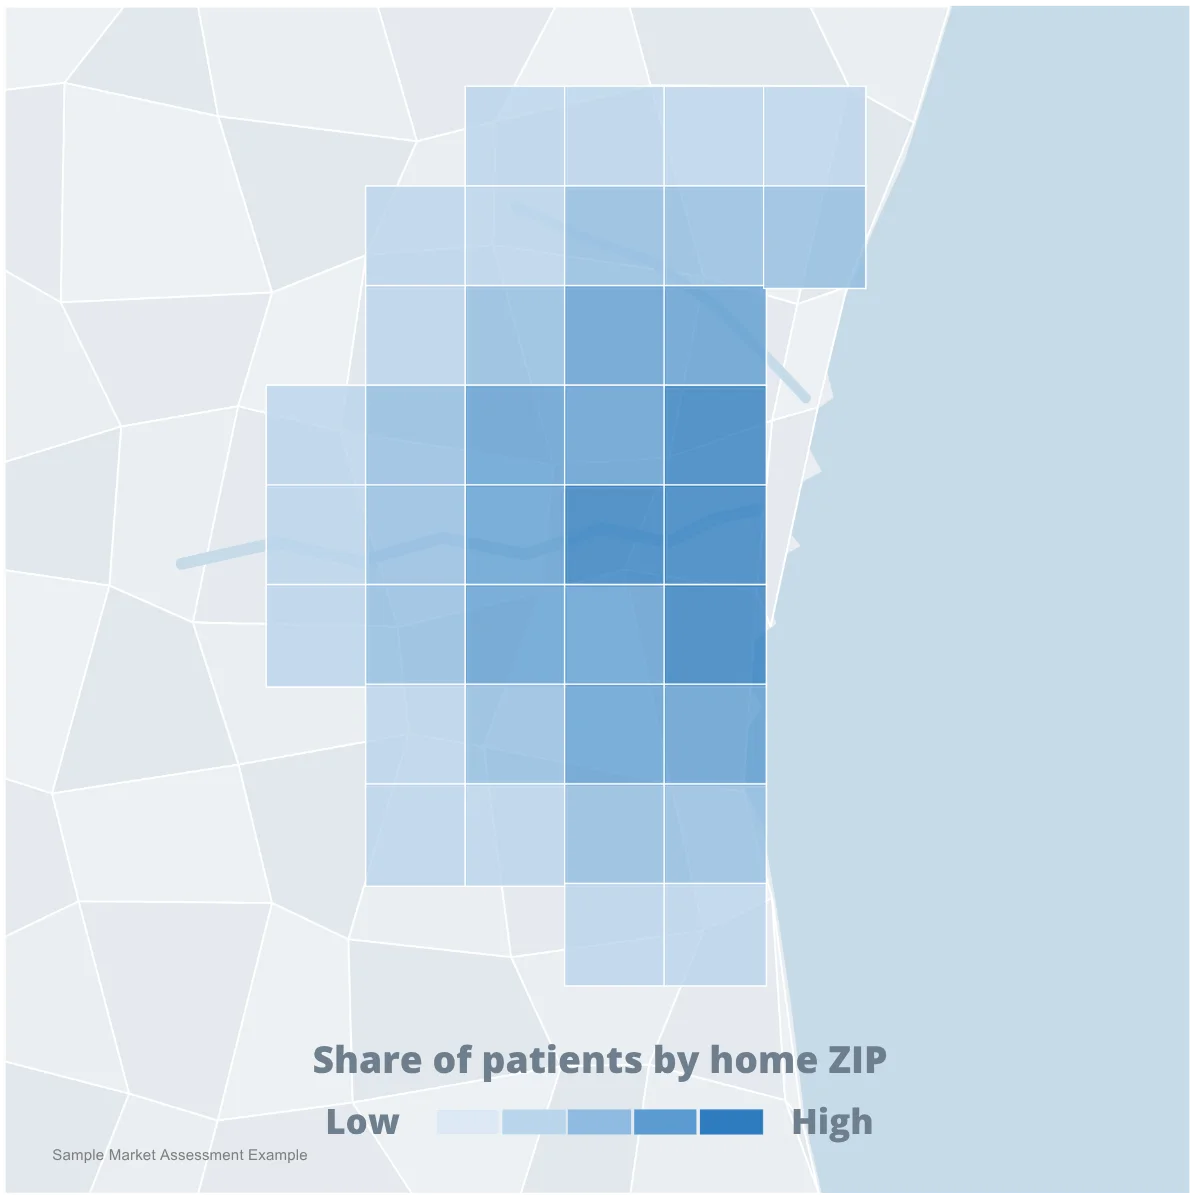
Where Your Patients Are Receiving PT
Two maps: the competitor sites treating your uncaptured patients, and the home ZIP codes those patients come from.
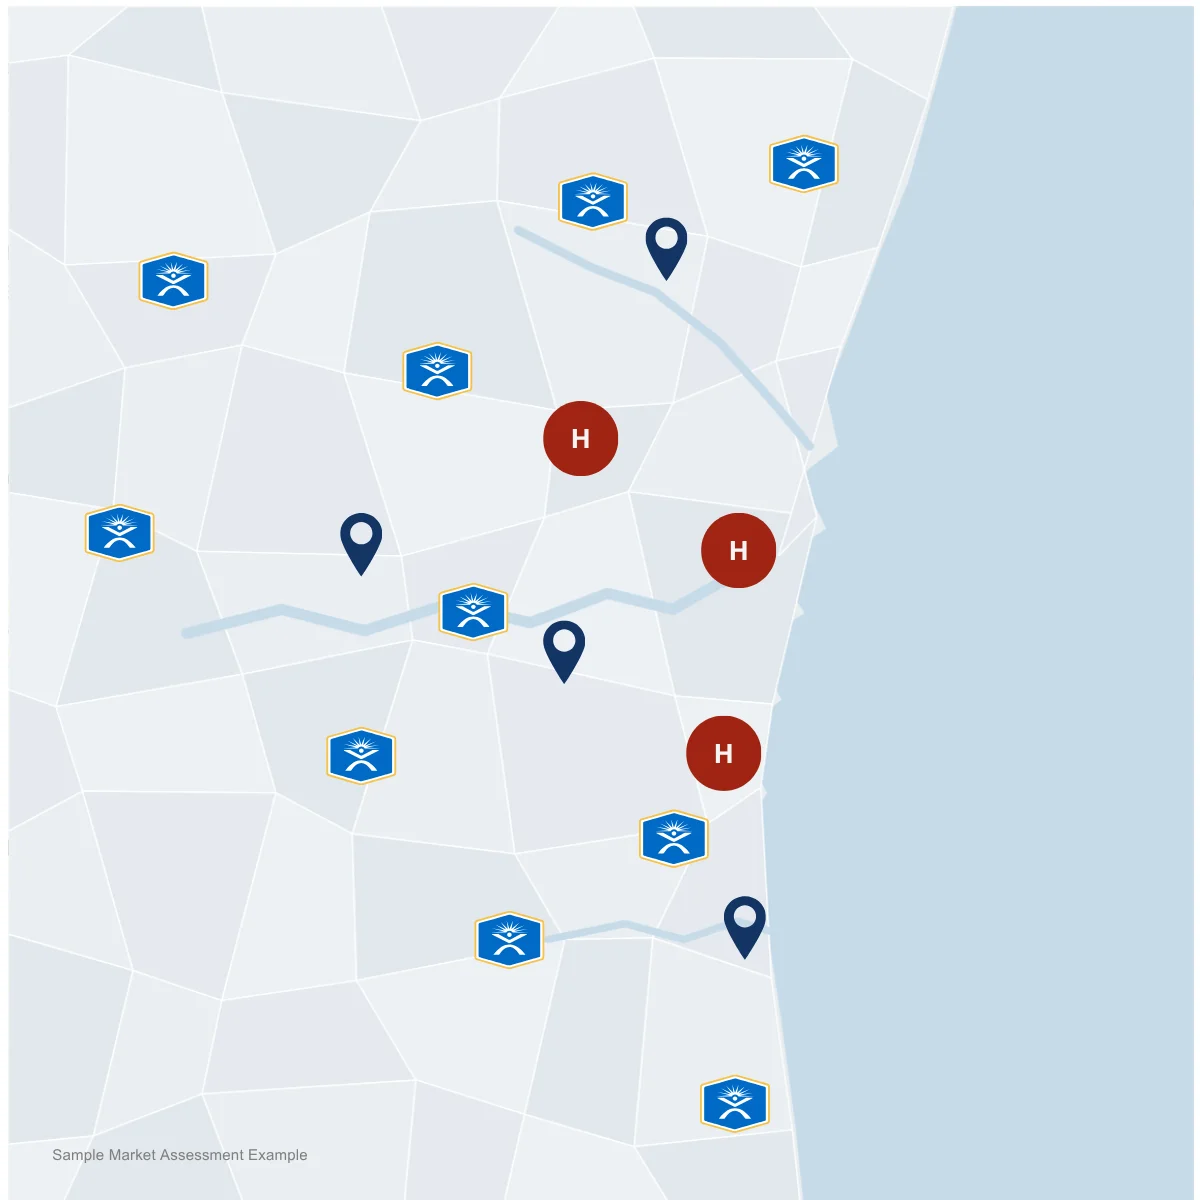
- Hospitals
- Health system clinics
- Recommended retail expansion clinics
Clinic Access & Growth Opportunities
Your hospitals and clinics mapped with data-backed submarket recommendations for retail expansion looking at unmet need, your MSK market share, and payer mix.
“We suffer with a lot of leakage, but we haven't made investments to increase our number of PT's. We know we need to grow & expand. We're just struggling with the way to do it financially.”
Request Your Custom PT Market Assessment
Share a few details below, and we’ll be in touch to discuss your custom assessment.
What happens next
- Submit your requestShare your health system and market.
- We build your market analysisOur team models referral capture and growth opportunities.
- Review findings with our teamWalk through results and next steps with your leadership.
We use your information only to prepare and discuss your assessment. We never sell or share it.
Proven History of Growth and Expansion

- 85+ hospital partners across 15 health systems
- 550+ locations
- 5,500+ team members
- 5M annual patient visits